When I ask a client to send me their 401(k) investment options for review, they generally send over a sheet that lists 15-20 mutual funds showing the trailing 1-,3-,5-, and 10-year returns of those funds. This sheet generally includes the expense ratio of each fund as well. Here is an example:
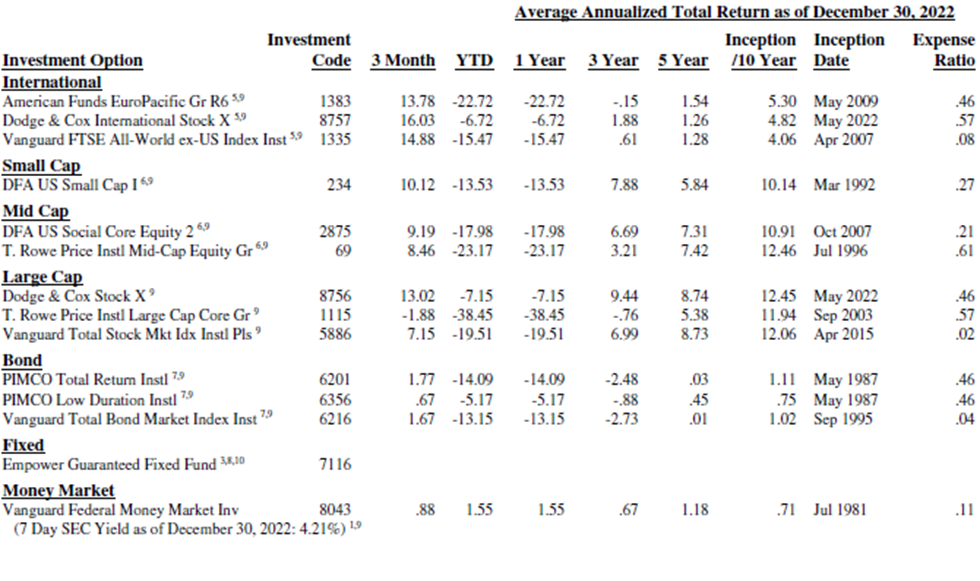
Over time, I noticed that most clients originally chose their 401(k) investments by picking the funds that had the best track records illustrated on these menus. If a fund had the best 10-year return, that's generally the one they went with. If a fund had relatively poor recent returns, they generally avoided it.
This approach seems logical, why wouldn't you pick the best performers? But there's a problem…
"If past history was all there was to the game, the richest people would be librarians." —Warren Buffett, 1988 shareholder letter
Recently, while meeting with a client, I mentioned that non-US equities have been outperforming US equities by a healthy margin lately. The client downplayed the event, suggesting non-US equities have only been a drag on returns for the prior 20 years.
The data tells a different story. For US investors, non-US equities have actually lagged for over 120 years. Let's look at the numbers from the 2024 UBS Investment Returns Yearbook:
US Equities = 6.5%
Non-US Equities = 4.3%
A 2.2% annual difference over 124 years compounds to an ungodly difference in ending wealth.
$10,000 compounded at 6.5% for 124 years turns into $24,623,589.
$10,000 compounded at 4.3% for 124 years turns into $1,850,351.
That's a staggering difference. Of course, none of us has a 124-year investment horizon (except maybe Bryan Johnson?), but surely 124 years of data showing this dramatic US outperformance is enough to conclude that nobody needs non-US equities, right?
Case closed?
Not even close.
We just saw significant US outperformance from 1900-2023, but that result is highly dependent on the start and end dates. I decided to go back a few years and pull the 2016 Investment Returns Yearbook (which was offered through Credit Suisse at the time).
In this edition, we see the following real returns from 1966-2015:
US equities = 5.3%
Non-US Equities = 5.4%
A 50-year period with essentially identical returns. Most of us would be lucky to have an investment horizon that long. But again, this really doesn't show much of a benefit to owning non-US equities does it?
Let's look more closely at this period. I'll cherry-pick the subperiod of 1970–1989, and we see the following nominal returns (before inflation):
US Equities = 11.25%
Non-US Equities = 16.08%
A 20-year period where non-US outperformed by nearly 5% annually.
Twenty years is nothing to sneeze at and is probably equivalent to half of one's working career.
Despite the dramatic 124-year US outperformance, there were extended periods within that timeframe when the opposite occurred. Can we predict which will lead? No.
One looking backwards might conclude there is no need to divesify beyond the United States, but a 1970 - 1989 period could certainly occur from which would make that decision a regretful one.
Many people do not appreciate how quickly the trailing 1-, 3-, 5-, 10-, and 20-year return numbers can change. All you need is for a few good years to appear at the end of the period, and a few bad years to drop off at the beginning.
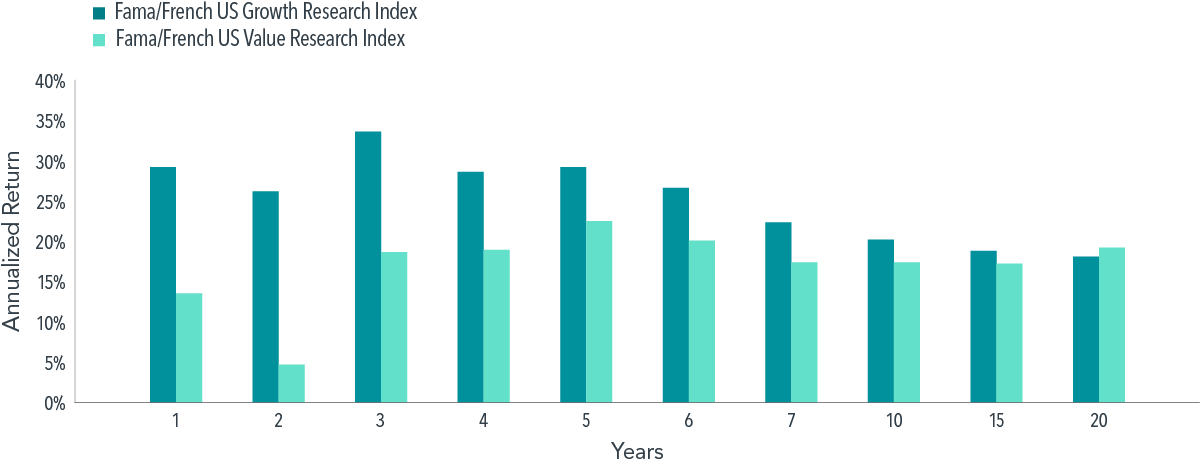
In a 2023 research paper, Brad Steiman of Dimensional Fund Advisors illustrated this concept perfectly. Below is a good example of how quickly these trailing returns can shift.
In this first image below, we're looking at the trailing returns of US Growth and US Value Stocks over various periods as of March 31, 2000. We see growth stocks handily outperforming value over the 1–15 year trailing periods:
In the next image, Steiman fast-forwarded just one year later to March 31, 2001 and again looked at the trailing period returns of US Growth and Value stocks:
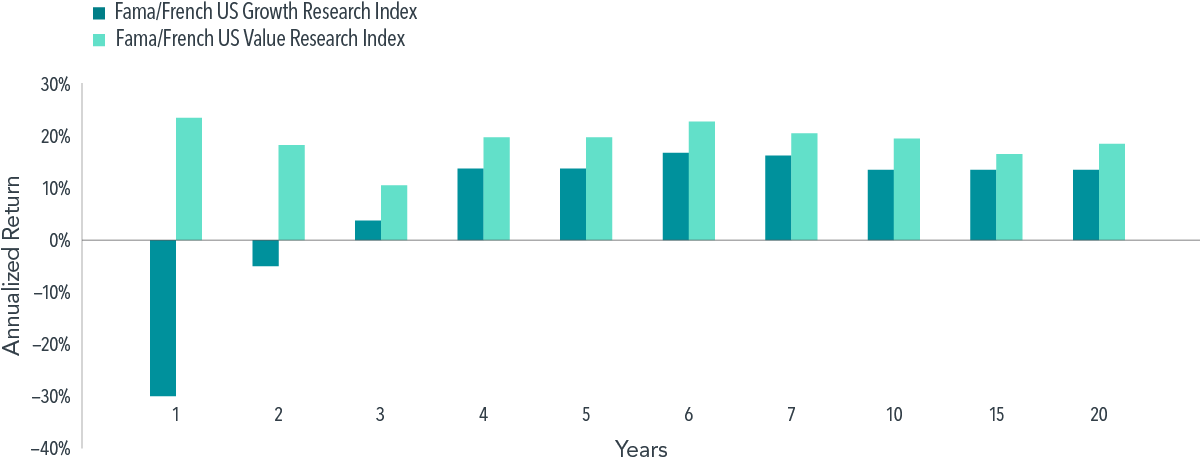
Now just one year later, you see that EVERY trailing period favors value stocks.
An investor looking backwards in 2000 sees little to no reason to own value stocks based on the prior periods. An investor looking backwards in 2001 sees little to no reason to own growth stocks based on the trailing periods. All that changed was 1 year and the entire narrative based on past history looks different.
When you're looking at potential investments and their trailing returns, remember: you're seeing a snapshot that could look completely different next year. Past performance tells you what happened, not what will happen. You're looking through the rearview mirror and not the windshield.
As we saw the trailing return picture can completely flip in a short amount of time.
Smart portfolio construction isn't about finding the funds with the best trailing returns, it's building a portfolio based on reasonable expecations for the future. This means:
"I skate to where the puck is going to be, not where the puck has been" -Wayne Gretzky
This content is for informational and educational purposes only and should not be construed as personalized investment, tax, or legal advice. All opinions expressed are as of the date of publication and are subject to change without notice. Any historical, hypothetical, or backtested performance data referenced herein has inherent limitations: it does not represent actual client accounts or actual trading, is not reduced by advisory fees or other expenses that would apply to a real account unless stated otherwise, assumes reinvestment of dividends and other earnings, and was calculated with the benefit of hindsight. Actual results will vary, and past performance does not guarantee future results. The value of investments will fluctuate so that shares, when redeemed, may be worth more or less than their original cost. References to specific securities, funds, or investment strategies are for illustrative and educational purposes only and do not constitute a recommendation to buy or sell any security. Not all recommendations will be profitable. Any testimonials or client comments referenced are not representative of the experience of all clients, are not indicative of future performance, and no compensation was provided in exchange for such statements. Information has been obtained from sources believed to be reliable, but its accuracy cannot be guaranteed. Nothing herein is a solicitation or offer to buy or sell any security. Meredith Wealth Planning, LLC is an SEC-registered investment adviser; registration does not imply a certain level of skill or training. For a full description of our services, fees, and any conflicts of interest, please review our Form ADV Part 2A and Form CRS at meredithwealth.com/disclosures.
A quick chat to get to know each other and learn more about what you're looking for in an advisor
We know that working with an advisor is a big decision, take some time & sleep on it
When you're ready, we get started with our planning process


.png)


